Unfogging the Farfield
Published:
When considering antennas and antenna arrays, one of the more useful and consistent abstractions are that of the plane wave, and the related concept of the farfield. These concepts are simplifications of the expanding spherical wavefronts in the limit of large distances. The approximation states that when considering a specific direction or set of directions the spherical wavefront can be approximated as a plane wave propagating in the direction of interest.
Abstractions and Simplifications
The important thing to remember when considering simulations of antennas and antenna arrays is that the farfield distance is an abstraction that reflects the distance at which the expanding spherical wavefront can be simplified as a plane wave. The reality is that as long as it is propagating, the electromagnetic waves are expanding spherical wavefronts, and hence this abstract introduces some level of phase error depending on the range from the transmitting antenna to the region of interest. Importantly, this variation in phase over the region of interest is dependent on the size of the transmitting antenna or array, the range, and the size of the region of interest. The definition of the farfield distance for an aperture is based upon the range at which the phase error across the receiving antenna is less than 22.5 degrees 1.
The Fraunhofer distance ($d_{f}$), which is accepted as the definition as the minimum distance at which the farfield approximation can be used based upon the wavelength of interest $\lambda$, and the diameter of the antenna/aperture $D$, is defined as:
\[d_{f}=\dfrac{2D^{2}}{\lambda}\]It is important to recognise that this distance is reciprocal, and if the region of interest is large enough, then the phase error will be increased. If the region of interest has a diameter which is larger than that of the aperture or antenna under consideration then the region of interest should be used when calculating the farfield for the approximation.
Farfield Analysis for a Horn Antenna

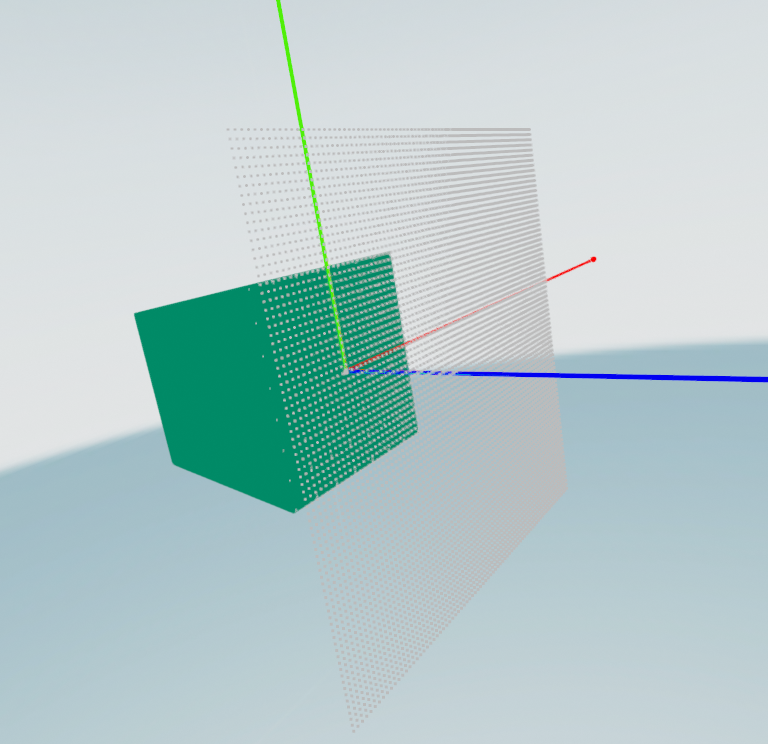
Figure 1 Rendering of the Computational Environment with LyceanEM
A relatively convenient way to investigate the distance at which the farfield criteria will be met by a specific antenna or antenna array. LyceanEM can be used to perform this modelling by defining a receiving aperture of interest, in Figure 1 with points separated by a tenth of a wavelength, at increasing distance in the z direction from the aperture of interest. This has been rendered within Open3D, showing the axes and the different sampling points.

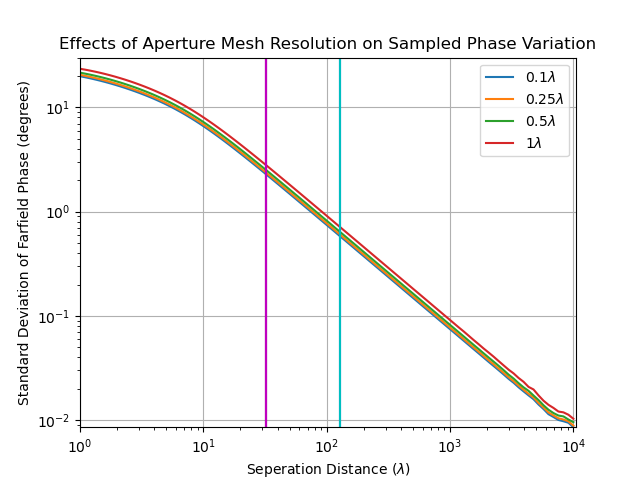
Figure 2 Effects of Aperture Mesh Resolution on Sampled Phase Variation
Figure 2 shows the standard deviation of the sample phase at the receiving aperture for a horn antenna with an aperture 4 wavelengths wide, and 4 wavelengths tall. Therefore the Fraunhofer distance at 10GHz is 96cm, or 32 wavelengths (magenta vertical line in Figure 1). A sampling aperture 8 wavelengths wide, and 8 wavelengths tall was used to sample the received phase with increasing seperation between the horn model and sampling aperture. Based on this size, the sampling aperture would have a Fraunhofer distance of 3.84m or 128 wavelengths (cyan vertical line in Figure 1). This is an interesting example of the importance of considering not just the antenna or array being simulated, but also the method used to measure it, as the interactions can have a significant effect on the results. The benefit of using standard deviation for this plot is that change in variation of the sampled phase points can be shown easily, with the collary that 99.7% of the phase values will be within a factor of 3 of the standard deviation, showing that the combination of apertures meets the definition of farfield at as short a range as 11 wavelengths.
It also makes clear the effect of aperture sampling resolution as the distances in a model increase.
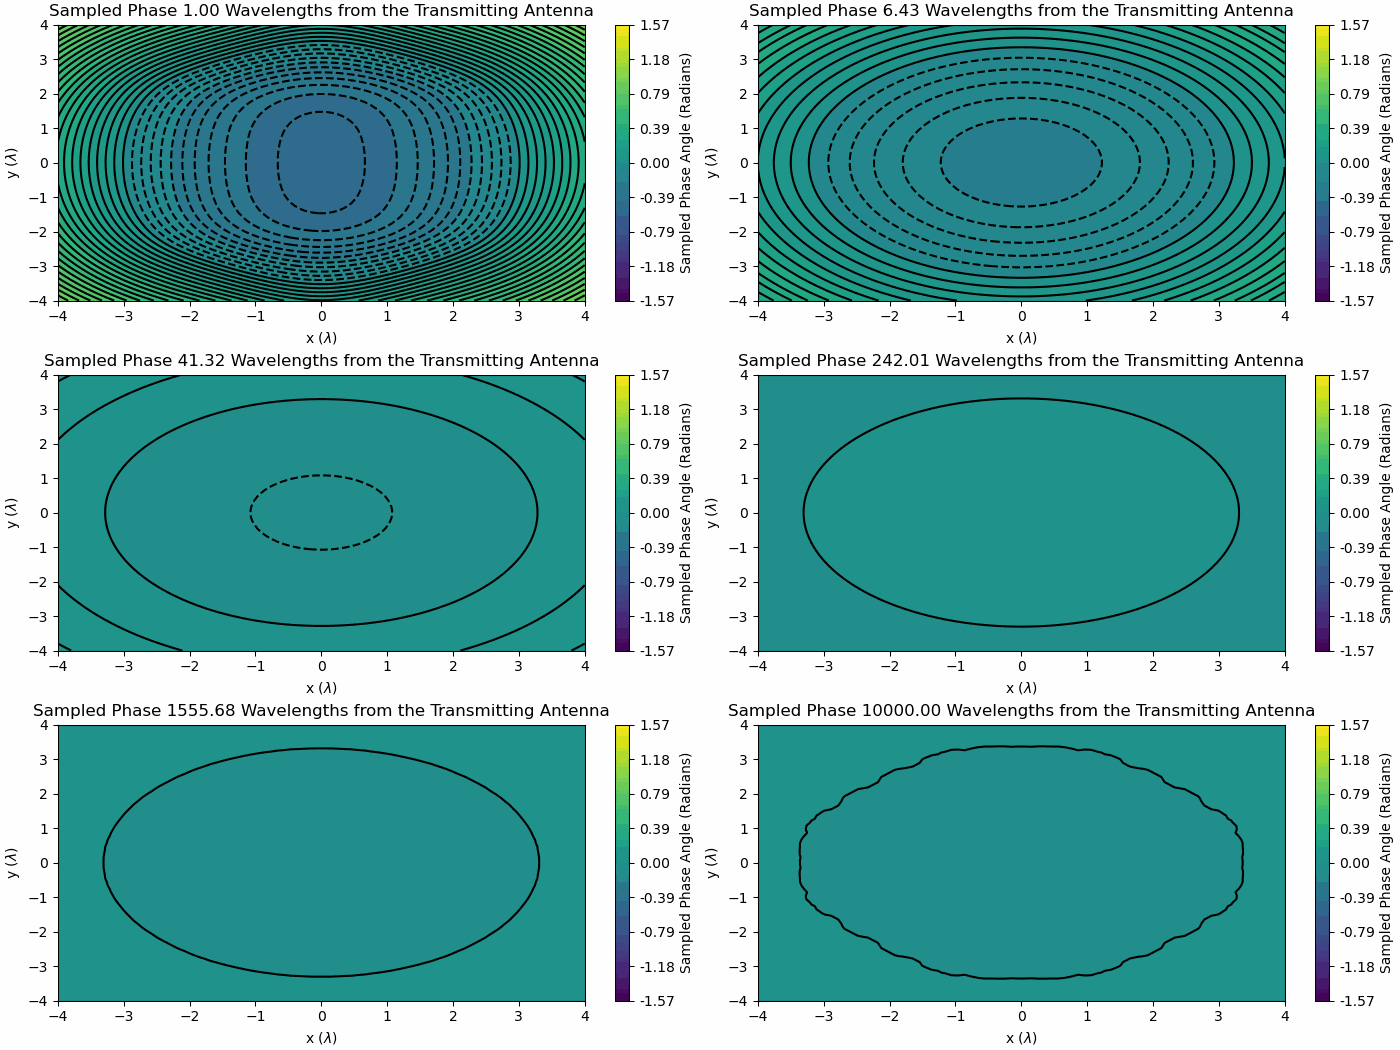
When the normalised phase at each point is animated, it is possible to get a more intuitive understanding of the way the phase distribution across an aperture changes with distance from the transmitting aperture, and this is included in Figure 2.

Figure 3 Sampled Phase across Receiving Aperture with increasing distance
In Figure 3 the contour lines denote an angular spacing of 5 degrees, so if there are less than four contour lines on the plot, that distances meets the definition of phase difference of less than 22.5 degrees across the region of interest.
E. Knott and T. B. Senior. “How far is far?” In: IEEE Transactions on Antennas and Propagation 22.5 (Sept. 1974),pp. 732-734. issn: 1558-2221. doi: 10.1109/TAP.1974.1140880. ↩
